
The pie chart is the most important part of data visualization. If you are looking for the code to draw the dynamic pie chart according to your data then you are in the right place.
Our website Coding Birds Online provides the very simple, to the point and 100% working source code with a complete guide. You can check this demo also.
What is a pie chart?
A pie chart (or a circle chart) is a circular statistical graphic, which is divided into slices to illustrate numerical proportions. In a pie chart, the arc length of each slice (and consequently its central angle and area), is proportional to the quantity it represents. You can read more about this chart from here.

Why it is used?
If you are using a web application or website or any report generation software then you might have noticed this feature. Graphical or visual representation of data is usually a requirement for this software.
For example, You are using an ERP system of any college you might have seen your attendance in pie chart. If you are making any software for attendance management, then it will be a great feature to that.
Starting to Code 🙂
Sounds interesting? I know surely you are. Now that’s enough to understand. So what are you waiting for? let’s get started. Visit highcharts.com for reference. If you click on this link, it will give you the same code but with static data.
- Create an HTML page (index.php) to display the pie chart
- Get the required imports like JavaScripts to draw a pie chart
- Paste these imports to the head tag of the index file.
- Paste the javaScript code above the closing tag of the body.
These are the required imports to create a dynamic pie chart.
 <script src="https://code.highcharts.com/highcharts.js"></script>
 <script src="https://code.highcharts.com/modules/exporting.js"></script>
 <script src="https://code.highcharts.com/modules/export-data.js"></script>
 <script src="https://code.highcharts.com/modules/accessibility.js"></script>
Step 1: Create index.php file
index.php
<!doctype html>
<html lang="en">
<head>
    <meta charset="UTF-8">
    <meta name="viewport" content="width=device-width, user-scalable=no, initial-scale=1.0, maximum-scale=1.0, minimum-scale=1.0">
    <meta http-equiv="X-UA-Compatible" content="ie=edge">
    <link rel="icon" href="https://codingbirdsonline.com/wp-content/uploads/2019/12/cropped-coding-birds-favicon-2-1-192x192.png" type="image/x-icon">
    <script src="https://code.highcharts.com/highcharts.js"></script>
    <script src="https://code.highcharts.com/modules/exporting.js"></script>
    <script src="https://code.highcharts.com/modules/export-data.js"></script>
    <script src="https://code.highcharts.com/modules/accessibility.js"></script>
    <title>How to create dynamic pie chart - Coding Birds Online</title>
    <style> .center-block { display: block;margin-left: auto;margin-right: auto; }</style>
</head>
<body>
<div class="container">
    <center>
        <div id="container"></div>
    </center>
    <img class="center-block" src="https://codingbirdsonline.com/wp-content/uploads/2019/12/cropped-coding-birds-favicon-2-1-192x192.png" width="50">
 </div>
<?php
include "config.php"; // connection file with database
$query = "SELECT * FROM bird_pie_chart"; // get the records on which pie chart is to be drawn
$getData = $connection->query($query);
?>
<script>
    // Build the chart
    Highcharts.chart('container', {
        chart: {
            plotBackgroundColor: null,
            plotBorderWidth: null,
            plotShadow: false,
            type: 'pie'
        },
        title: {
            text: 'Programming Language Popularity, 2020'
        },
        tooltip: {
            pointFormat: '{series.name}: <b>{point.percentage:.1f}%</b>'
        },
        accessibility: {
            point: {
                valueSuffix: '%'
            }
        },
        plotOptions: {
            pie: {
                allowPointSelect: true,
                cursor: 'pointer',
                dataLabels: {
                    enabled: false
                },
                showInLegend: true
            }
        },
        series: [{
            name: 'Popularity',
            colorByPoint: true,
            data: [
                <?php
                $data = '';
                if ($getData->num_rows>0){
                    while ($row = $getData->fetch_object()){
                        $data.='{ name:"'.$row->programming.'",y:'.$row->popularity.'},';
                    }
                }
                echo $data;
                ?>
            ]
        }]
    });
</script>
</body>
</html>
In this file, I am including a config.php, which is a connection file to the database. I am fetching records from the bird_pie_chart table. Don’t worry, I will provide the complete source code. The following is the database table structure.
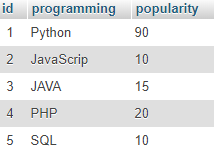
In this example, I am showing you a comparison of programming languages, with dummy data. This is now the actual data. You can customize this code and database table according to your needs.
Step 2: Run the code to get the desired output !!! That’s it.
Output
when you run the code and make sure everything is fine, then you will get the same output as following.

Source Code & Demo to make a dynamic pie chart
You can download the full 100% working source code from here. You check this demo also.
Conclusion
I hope you learned explained above, If you have any suggestions, are appreciated. And if you have any errors comment here. You can download the full 100% working source code from here.
Happy Coding 🙂